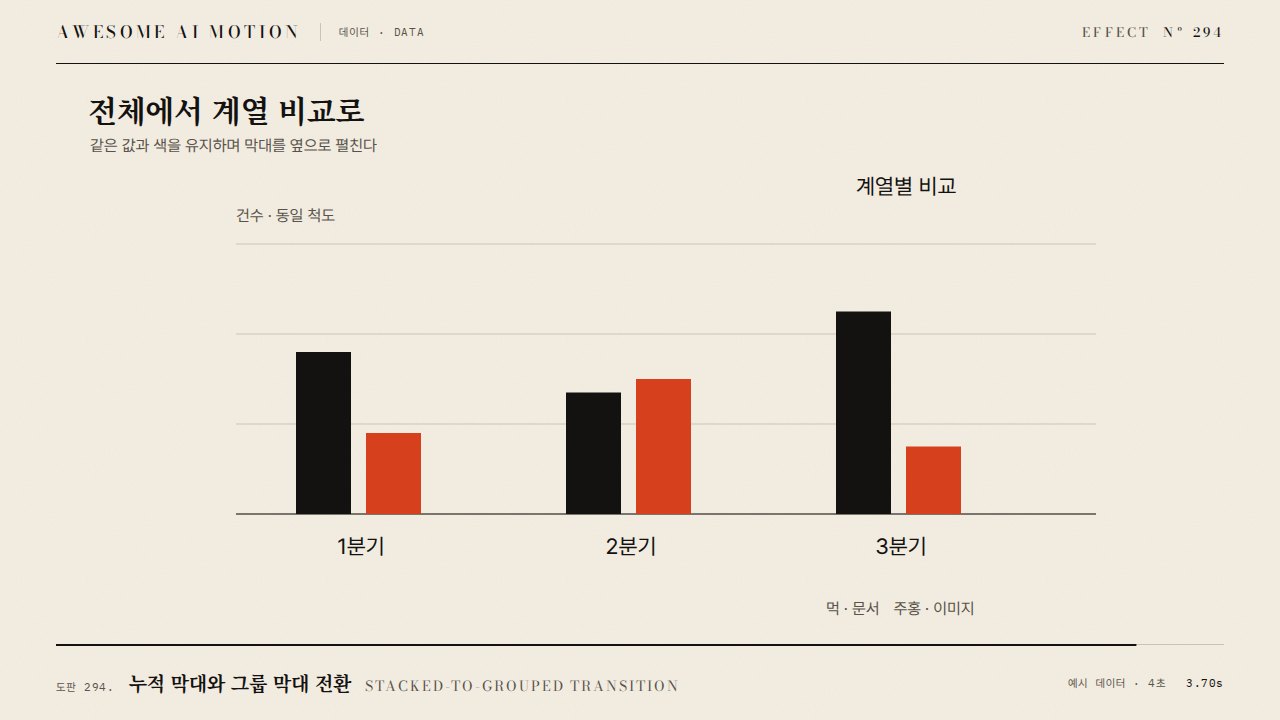
차트 단계 전환Staged Chart Transition
축 변경, 위치 이동, 크기 변경을 한꺼번에 하지 않고 단계별로 나눠 진행하는 차트 전환Axis change, position move and size change run as separate stages instead of all at once.
무엇을 전하나What it tells
- 차트 종류나 축을 바꾸며 값도 갱신될 때
- 막대에서 산점도로 넘어갈 때 축과 위치와 크기를 차례로 보여 줄 때
- When the chart type or axis changes while values also update
- When moving from bars to a scatter plot and showing axis, position and size in turn
- 단계는 3개 이하
- 단계 사이 간격 0.08~0.2초
- 마지막 단계 뒤 0.5초 이상 정지
좋은 예와 나쁜 예Good and bad use
1단계 축 눈금이 0.4초 바뀌고, 0.12초 뒤 점이 새 위치로 이동하고, 다시 0.12초 뒤 크기가 바뀐다
세 변화를 0.4초에 한꺼번에 일으켜 무엇이 바뀌었는지 알 수 없다
파라미터Parameters
기본값은 클립에 쓴 값Defaults are the values used in the clip
| 항목PARAM | 기본DEFAULT | 범위RANGE | 메모NOTE |
|---|---|---|---|
| 단계 길이 | 0.4s | 0.3~0.6s | 각 단계의 tween 길이 |
| 단계 간격 | 0.12s | 0.08~0.2s | 다음 단계 시작 전 여유 |
| 단계 수 | 3 | 2~3 | 축, 위치, 크기 순 |
| 이징 | power2.inOut | power2~power3.inOut | 각 단계마다 동일 |
const T = 0.4, G = 0.12;
tl.to('.axis', { attr: { 'data-scale': 1 }, opacity: 1, duration: T, ease: 'power2.inOut' }, 0.3)
  .to('.dot', { x: (i, el) => +el.dataset.nx, y: (i, el) => +el.dataset.ny, duration: T, ease: 'power2.inOut' }, 0.3 + T + G)
.to('.dot', { attr: { r: (i, el) => el.dataset.nr }, duration: T, ease: 'power2.inOut' }, 0.3 + 2 * (T + G));에이전트 프롬프트Agent prompts
그대로 붙여 넣는다Paste as is
GSAP으로 <대상> 차트 전환을 3단계로 나눠줘. 0.3초에 축을 0.4초 동안 바꾸고, 0.12초 쉰 뒤 점을 새 위치로 0.4초, 다시 0.12초 뒤 점 크기를 0.4초 바꿔. 이징은 power2.inOut, 마지막 단계 뒤 0.6초 정지. 데이터는 dataset에 미리 넣고 paused 타임라인 하나에 절대 시각으로 배치해.
Split the <target> chart transition into 3 stages with GSAP. At 0.3s change the axis over 0.4s, rest 0.12s, move the dots to new positions over 0.4s, rest another 0.12s, then change dot size over 0.4s. Ease power2.inOut and hold 0.6s after the last stage. Precompute data in dataset attributes and place everything at absolute times on one paused timeline.
<파일>의 <대상>에 staged-chart-transition을 적용해. T=0.4, G=0.12로 축(0.3s), 위치(0.3+T+G), 크기(0.3+2*(T+G))를 순서대로 tween. 0.5초·1.0초·1.6초 시점을 캡처해 각 시점에 한 종류의 변화만 진행 중인지 확인해.
Apply staged-chart-transition to <target> in <file>. With T=0.4 and G=0.12, tween the axis at 0.3s, position at 0.3+T+G and size at 0.3+2*(T+G) in that order. Capture at 0.5s, 1.0s and 1.6s and check that only one kind of change is in progress at each moment.
도구별로 쓰기In your tools
HyperFrames · ReelForge · Scrolline
잘 맞는 조합Pairs well with
출처Sources
개념 출처와 라이선스. 구현은 이 레포에서 새로 씀Concept sources and licenses. Implementations are original to this repo
- Heer & Robertson 2007unknown
- uwdata/geminiBSD-3-Clause
- Observable @d3unknown